Case Study: Pull the Goalie
Coach the Last Minutes of a Real NHL Game
At a glance
- Client
- Pull the Goalie
- Industry
- Sports (browser game)
- My role
- Designer & developer · Solo project
- Timeline
- 2026
- Services
- Apps & games, Analytics
Headline results
- Designed, built and launched solo, a free daily game with no ads and no account needed
- Every call graded by a win-probability model fit on 3,936 NHL games
- A data hub around the game: the Goalie Pull Report, a pull calculator and a page for every close finish
About Pull the Goalie
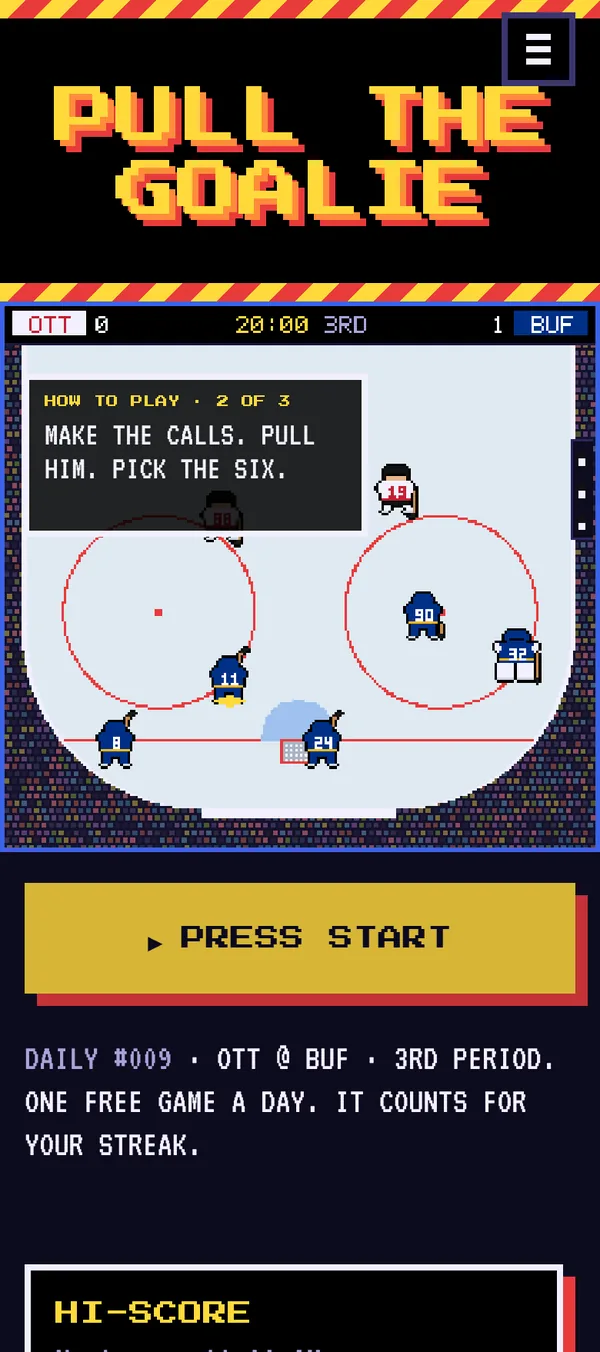
Pull the Goalie is a free daily hockey game for people with strong opinions about when the goalie should come out. Each day it hands you the bench for the third period of a real NHL game from the night before: who goes over the boards, how hard to push, when to pull the goalie and which six skaters to send out. Then it grades every call and shows you what really happened.
It plays in the browser, on a phone or a laptop, with no ads and no account needed. One game a day, the same one for everyone, so players can compare results with their group chat.
Summary
Every hockey fan has coached from the couch, and the last minutes of a one-goal game pack more real decisions into less time than anything else in sports. I wanted a game that put fans in that seat with real stakes and real players, and then told them honestly whether their instincts held up, and whether the real coach’s did.
I designed and built it myself: the game, the data model behind the grades, the 8-bit look, and the site around it.
Approach
Real games, real rosters
The daily is a real third period from the night before, starting at 20:00 with the real score after two. You see the real roster with each player’s numbers as of that moment, and nothing he did later. Every skater has a legs meter that drains with ice time, on both benches, so your best players are also your most tired ones. That tension is the whole puzzle.
Every call graded against a model
Every option on the board carries a chance to win, from a model fit on every regular-season game of the last three NHL seasons, 3,936 games. It measures how often goals go in by score, strength and time, then plays out the rest of regulation second by second for any plan. It’s an exact calculation, not a random simulation, so the same game always gives the same numbers.
A grade judges the decision, not the outcome: how much of your team’s chance a call gave up against the best option on the board. It comes back as one square per call: good call, fair, a bit costly or costly. Players share their squares, the way they would a daily word game.
Built for a phone in a crowded concourse
The look is a love letter to the hockey video games and arcade cabinets a lot of us grew up with: chunky sprites, hard shadows and a scoreboard that buzzes. A pixel rink also keeps the focus on the decisions, and it loads fast on a phone in a crowded arena concourse.
More ways to play
Past the daily there’s the Gauntlet (win real third periods in a row), the Shootout (call the shooter and his move, then stop theirs), the Playoffs (take one team through the real 2026 playoffs), Coach a Season, Classic Games (famous playoff finishes) and every past daily.
Built to be found
The model doesn’t just grade the game. It powers pages that answer questions hockey fans search for: when to pull the goalie, when each NHL team really pulls, and which pulls came late. The Goalie Pull Report covers 784 close games from 2025–26, every close finish gets its own page with the model’s verdict, and a calculator gives the model’s call for any score, clock and strength.
Honest about the data
Pull the Goalie is an independent fan project with no tie to the NHL, and says so. A page called What It Tracks spells out which parts of every game are real, which are staged, and what the game can’t do yet. Patch notes log what changed, day by day.
Where it stands
- Live at pullthegoalie.app, free, with a new game every morning
- Grades from a model fit on 3,936 NHL games across three seasons
- Five more ways to play beyond the daily, plus the Goalie Pull Report and a page for every close finish
The results in numbers
The model
- NHL games behind the model
- 3,936
- Seasons of data
- 3
- Close 2025–26 finishes written up
- 784
Chance to win, down one with 7:00 left
| Pull at 2:30 | 13.64% |
|---|---|
| Pull at 1:00 | 12.43% |
| Never pull | 10.69% |
The Goalie Pull Report, down one
- Average NHL pull
- 1:54
- The model’s best window
- 2:50–2:20
NHL teams pull later than the model would, on average.